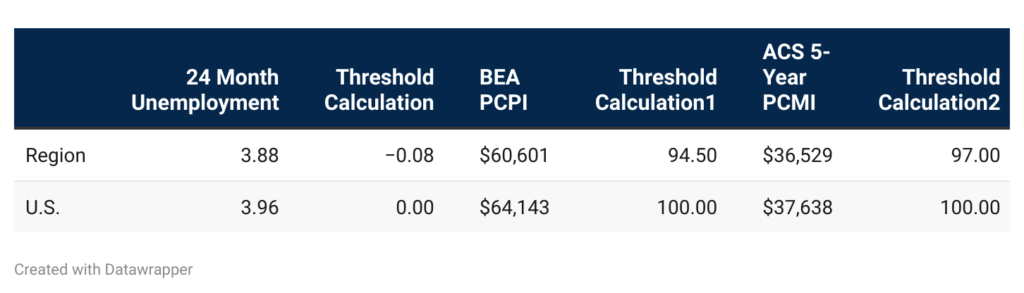
The table below illustrates the 24-month average unemployment, Per Capita Money Income (PCMI), and Per Capita Personal Income (PCPI) for the KIPDA region and for the U.S. and shows the corresponding threshold calculations that show how distressed our region is in these areas compared to the rest of the nation.
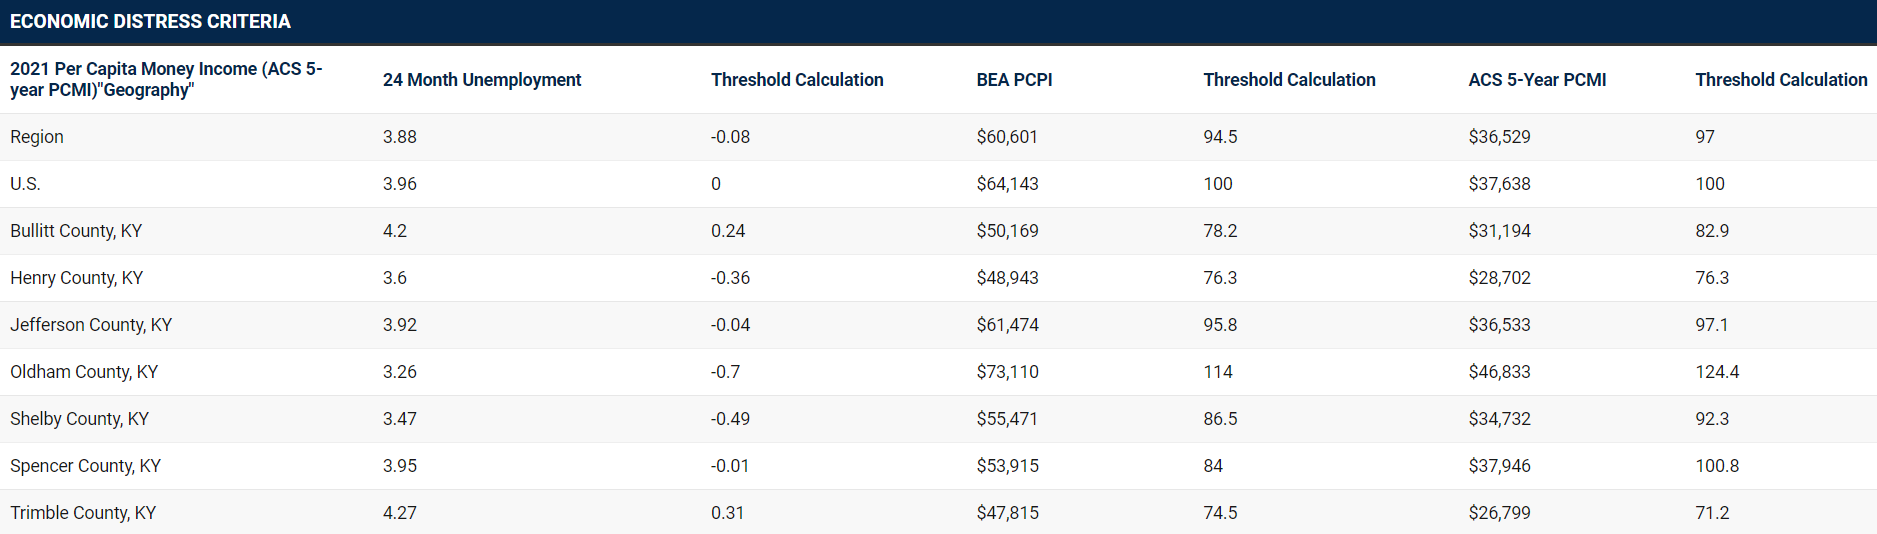
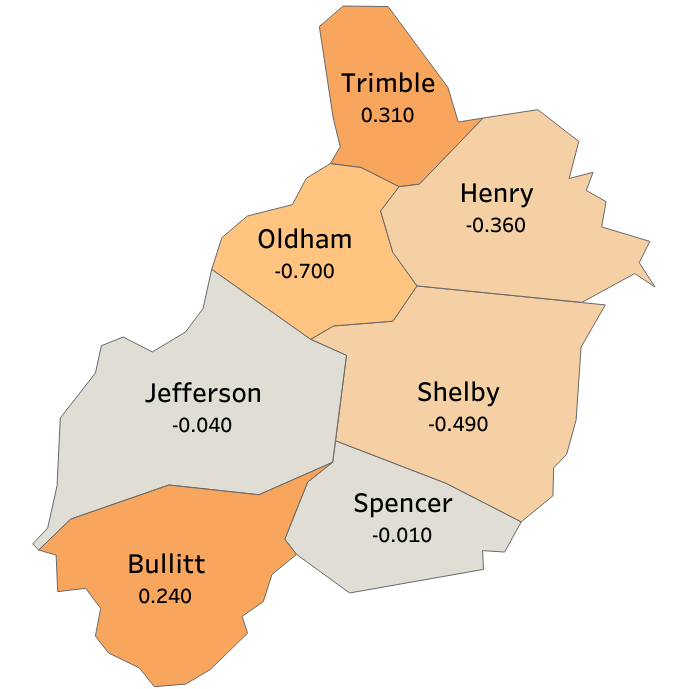
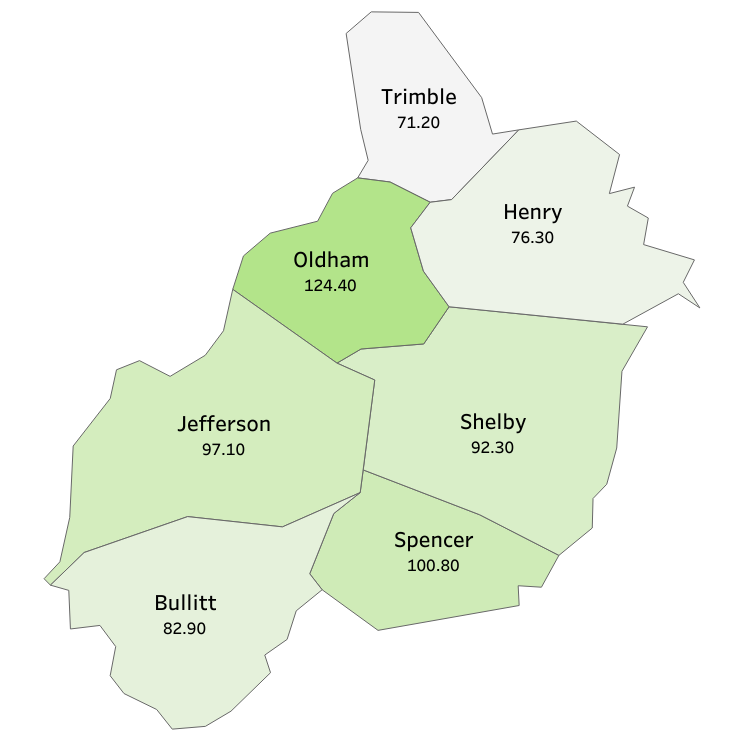
The table below illustrates the 24-month average unemployment, Per Capita Money Income (PCMI), and Per Capita Personal Income (PCPI) for all seven KIPDA counties in the KIPDA region and for the U.S. and shows the corresponding threshold calculations that show how distressed each county is in these areas compared to the rest of the nation.